
Read from the Small Cell
The project’s Small Cell observer reads the management API: cell and UE statistics, configuration and protocol events. It runs on the Core VM and uses the management network; N2 carries gNB–AMF signalling separately.
Metrics show what changes. Logs explain the events behind those changes. Our monitoring stack connects the Small Cell, Open5GS Core and application traffic so that a connection can be investigated across the network.
The Small Cell provides radio statistics and protocol events. Collection, storage and Grafana run on the Core VM. This combination makes the system observable: measurements and events help explain its internal state.
Scroll sideways to explore the diagram, or open the full-size version.
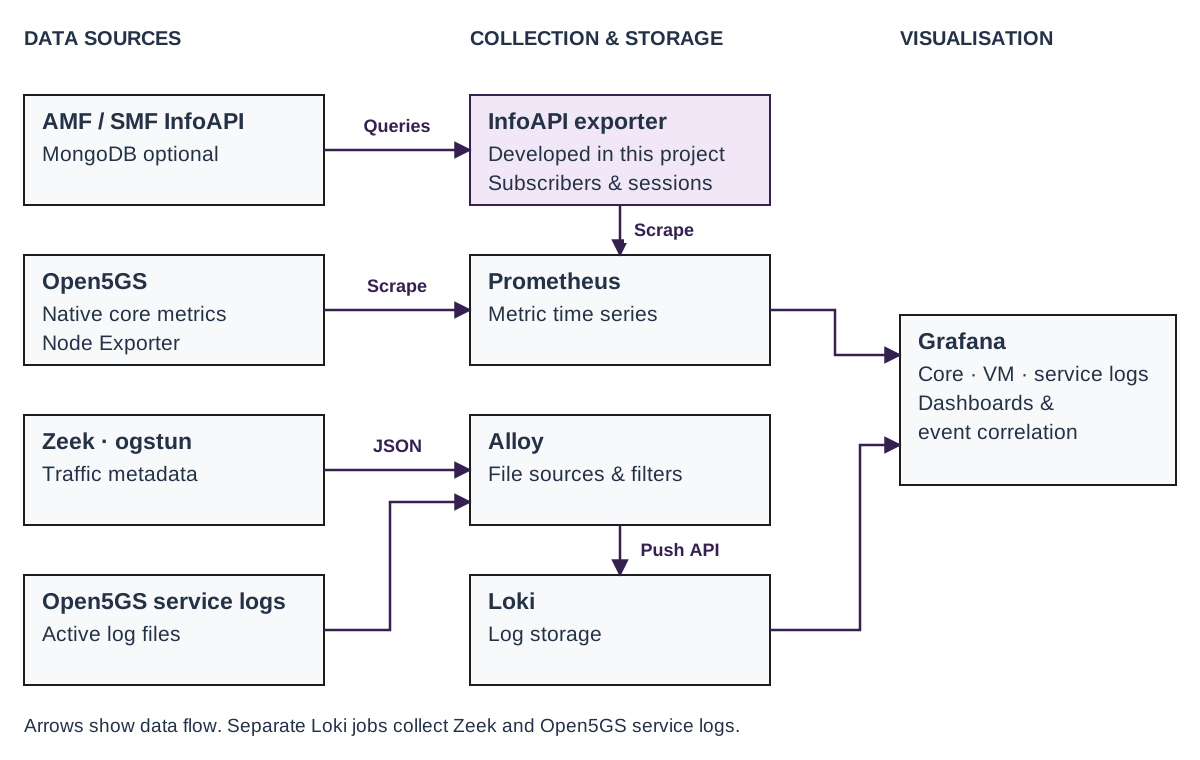
The project’s Small Cell observer reads the management API: cell and UE statistics, configuration and protocol events. It runs on the Core VM and uses the management network; N2 carries gNB–AMF signalling separately.
Prometheus scrapes the observer, native Open5GS metrics, the custom InfoAPI exporter and Node Exporter. It also evaluates alert rules. Alloy ships Small Cell events, Open5GS service logs and Zeek records to Loki.
Grafana queries Prometheus and Loki. The InfoAPI exporter associates AMF and SMF state; Small Cell context identifiers and Core events connect radio observations to a particular session.
Each source observes a different part of the connection. Radio bitrate, Core-interface traffic and application throughput refer to different measurement points.
| Source | Available observations | What they tell us |
|---|---|---|
| Small Cell · cell | UL/DL PHY bitrate, GTP payload bitrate, resource use, UE and bearer counts, TX/RETX/ERR | Radio activity, load and reported transmission outcomes. Native block values are snapshots; summing them does not produce a reliable event total. |
| Small Cell · UE | PUSCH SNR, CQI, rank, UL/DL MCS, layers and estimated path loss | SNR describes signal-to-noise ratio, CQI the reported channel quality, and MCS the selected modulation and coding. Values belong to a UE context; an observation slot can later belong to another device. |
| Small Cell · RF and configuration | Band, ARFCN, antenna/layer configuration, RF frequency and gain; sample and decoder diagnostics | The configured radio setup and hardware diagnostics. Gain settings are not calibrated radiated power; native diagnostic timings are not network latency. |
| Open5GS | Registrations, PDU sessions, gNB connection state and matching session details | Whether the Core knows the UE and has established a data session. The InfoAPI exporter connects AMF and SMF observations. |
| Core VM | CPU, memory, filesystem and network-interface metrics | Host load and resource pressure that may affect Core or monitoring services. |
| UE and application tests | Modem RSRP/RSRQ/SINR, round-trip times, iperf goodput and application responses | Additional run-specific measurements collected at the client or receiver. These complement the continuous VM collection. |
No data is different from zero. An idle UE may retain its last CQI or SNR value even when the API responds successfully. Unknown source units remain native diagnostic values.
The internal Grafana views separate the Small Cell’s protocol trace from Open5GS server logs. Both can be inspected over the same time window.
Start with collection status, data age and current UE contexts, then inspect traffic, resource use and signal quality. Expand the cell/RF configuration and diagnostics when investigating a specific issue.
The Small Cell table lists source time, direction, protocol, UE, cell, channel and message name. Open the body inspector for the decoded content. The adjacent Core panel shows service messages; each side has its own filters.
Use the panel menu → Explore to carry the query, filters and time window into Grafana Explore. Zeek records show traffic observed at the UPF’s ogstun interface, including application protocols where decoded.
Small Cell source timestamps are preserved, while Loki selects these events by observer receipt time. Account for clock differences when comparing hosts. The event table is a bounded view; exports preserve the available run data.
For a selected test window, establish the device and session context first. The following workflow explains where to look; it is not a new captured protocol trace.
Small Cell protocol events + Open5GS AMF logs
Follow the available RRC, NAS and NGAP messages and the AMF registration record. Use Core identity evidence and the RAN/AMF context pair to attribute the sequence to the tested UE.
Decoded messages + AMF/SMF logs + InfoAPI
Inspect authentication and security activation where decoded, then check PDU-session establishment, DNN and assigned UE address. These details anchor the later traffic observations.
Radio metrics + Zeek at the UPF + client or receiver
Compare radio activity with traffic for the assigned UE address. Use the HTTP response, iperf result or received weather value to establish the application outcome.
Timeline across all three observation points
For a failed probe, inspect release/reactivation events, traffic and capture coverage together. This helps distinguish an absent observation from a failed request; a timestamp coincidence alone does not establish the cause.
The public site provides an overview. Detailed session investigation and run exports use the internal research tools.
Selected Core and VM aggregates show network activity and service states. The public JSON API supplies the same allowlisted data.
The observer keeps a bounded archive of API responses. Authenticated downloads let benchmarks preserve their time window before rotation. Check the export’s coverage; native Small Cell dumps remain a separate source.
An authenticated MCP service lets analysis clients query monitoring data through Grafana. It supports AI-assisted investigation without granting network configuration access. Diagnostic effectiveness still needs a separate evaluation.